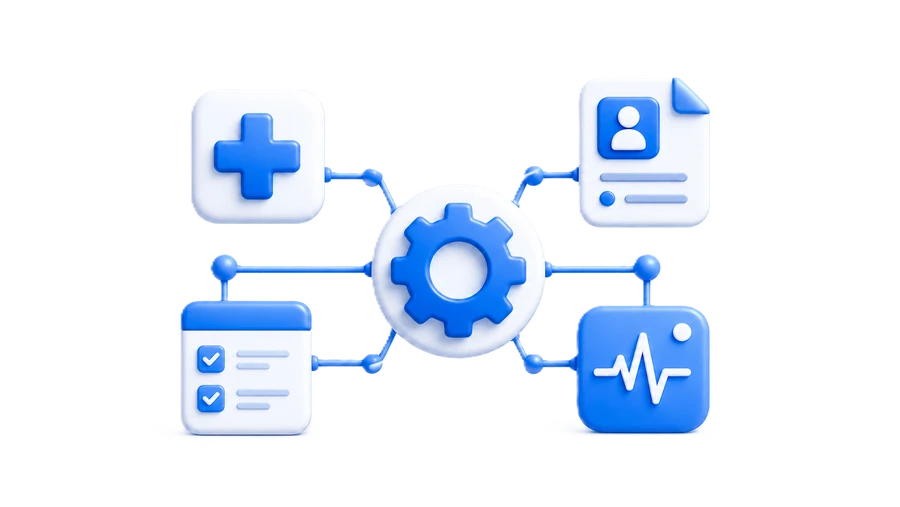
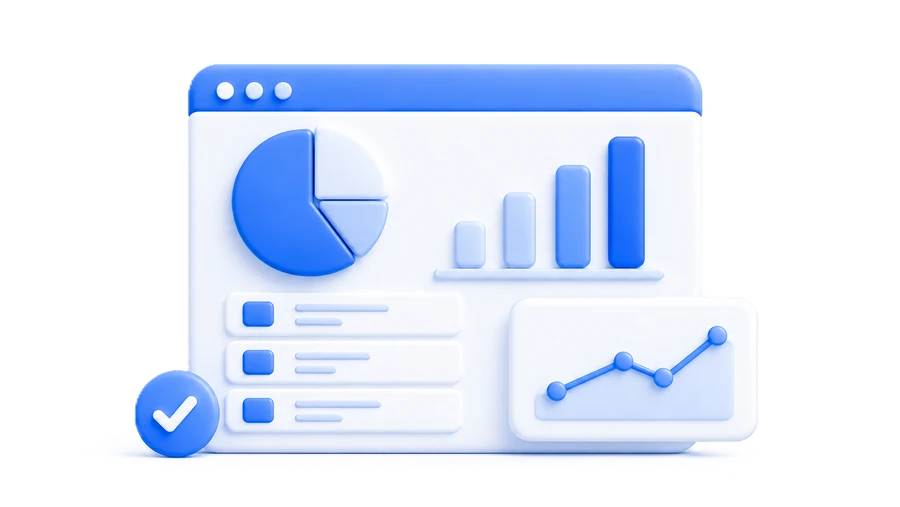
Healthcare organizations generate vast amounts of data, but collecting information alone does not create value. Data becomes useful when it is transformed into clear insights that support clinical, operational, and strategic decisions.
Healthcare analytics and visualization solutions help organizations monitor performance, identify trends, measure outcomes, and detect opportunities for improvement. Interactive dashboards and automated reports make this information accessible to healthcare professionals and organizational leaders.
In this article, we explore common healthcare analytics applications and explain the process we follow to integrate data, develop meaningful metrics, and deliver intuitive dashboards tailored to each organization’s goals and workflows.
Common Use Cases
Healthcare analytics can support decision-making across virtually every department. These are some of the most common analytics and visualization solutions we develop.
KPI Dashboards
Consolidate clinical, operational, and financial metrics into interactive dashboards that help teams monitor performance, identify trends, and track progress.
Patient Outcome Analysis
Measure clinical outcomes across treatments, services, and patient populations to evaluate care effectiveness and support quality-improvement initiatives.
Population Health Monitoring
Analyze population-level trends, disease prevalence, healthcare utilization, and outcomes to support preventive care and long-term planning.
Risk Stratification
Combine clinical, demographic, and operational data to identify high-risk patients and support earlier, more targeted interventions.
Operational Analytics
Monitor service demand, staffing, bed occupancy, appointment capacity, and resource utilization to identify bottlenecks and improve operations.
Quality Improvement Analytics
Track quality indicators, guideline adherence, and clinical performance to identify improvement opportunities and support continuous quality initiatives.
Our Approach to Data Analytics & Visualization
Every analytics project begins with a different combination of goals, users, systems, and data-quality challenges. A technically correct dashboard will still provide limited value if its metrics do not reflect the organization’s priorities or if users cannot interpret the information easily.
Our approach focuses on creating reliable data foundations, meaningful metrics, intuitive visualizations, and maintainable reporting solutions aligned with real clinical and operational decision-making needs.
End-to-End Process
From fragmented data to actionable insights
Each phase helps ensure that the final analytics solution is accurate, relevant, understandable, and aligned with the organization’s goals.
-
Step 1
Initial Assessment & Planning
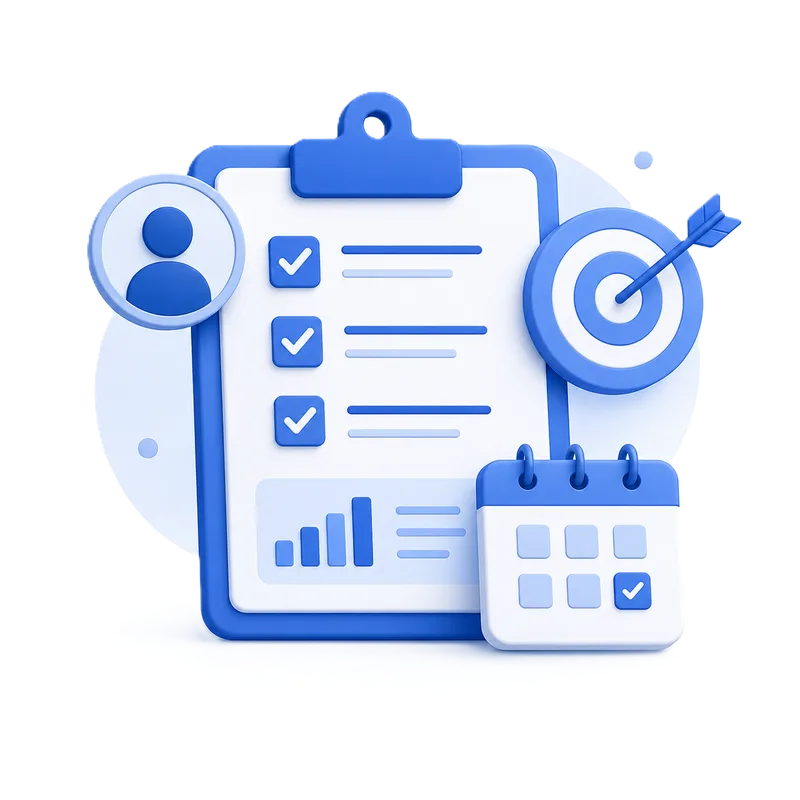
We work with stakeholders to identify the questions the solution should answer, the metrics that matter most, the intended users, and how the resulting insights will support clinical or operational decisions.
We then assess available data sources, identify potential limitations, define the dashboards and reports required, and establish a clear roadmap from data acquisition to final delivery.
-
Step 2
Data Integration & Preparation
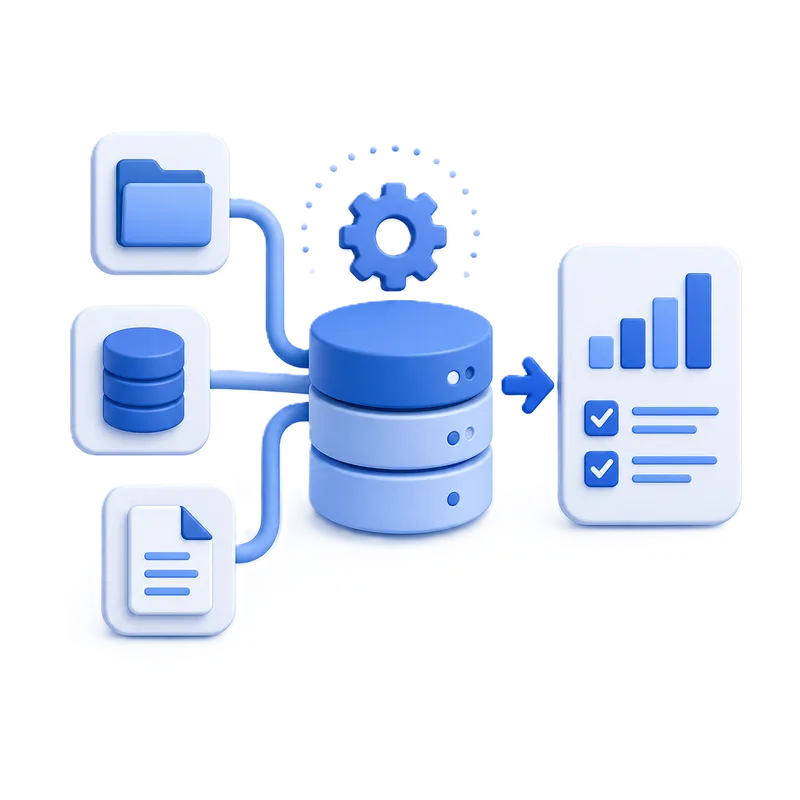
We collect, clean, validate, and integrate data from the relevant sources into a consistent, analysis-ready dataset. Depending on the project, this may include EHRs, laboratory systems, scheduling platforms, databases, spreadsheets, APIs, or external datasets.
Data formats are standardized, inconsistencies are resolved, missing or duplicated information is reviewed, and quality-control processes are implemented before analytics development begins.
-
Step 3
Analytics & Dashboard Development
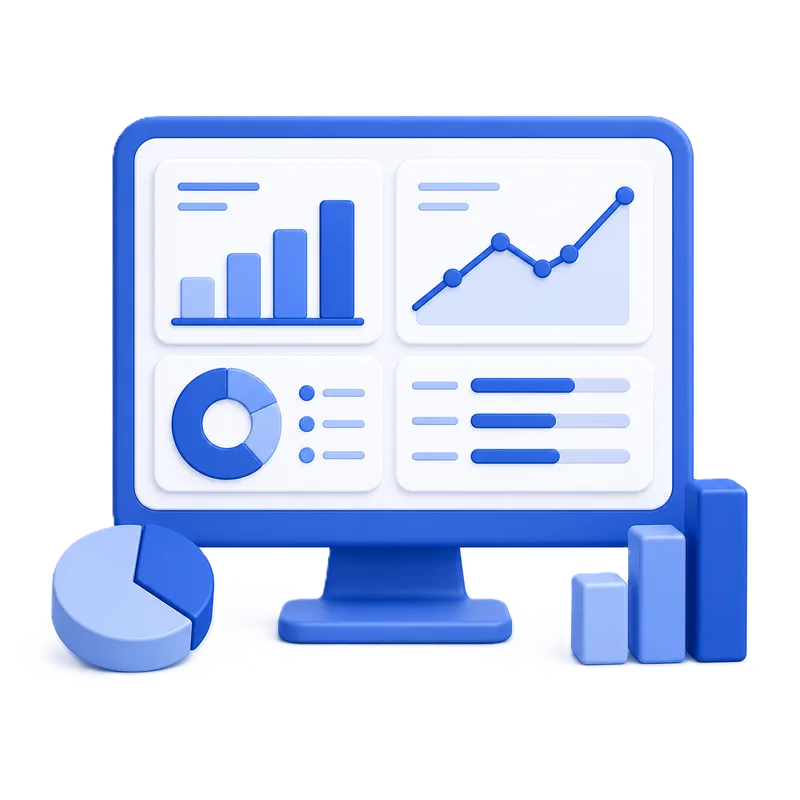
With a reliable dataset in place, we calculate the KPIs, trends, comparisons, and indicators required to answer the organization’s questions. This may include custom business logic, statistical analysis, benchmarking, forecasting, or predictive analytics.
The results are presented through interactive dashboards and automated reports designed around the intended users, with clear navigation, filters, drill-downs, and consistent metric definitions.
-
Step 4
Deployment & Ongoing Support
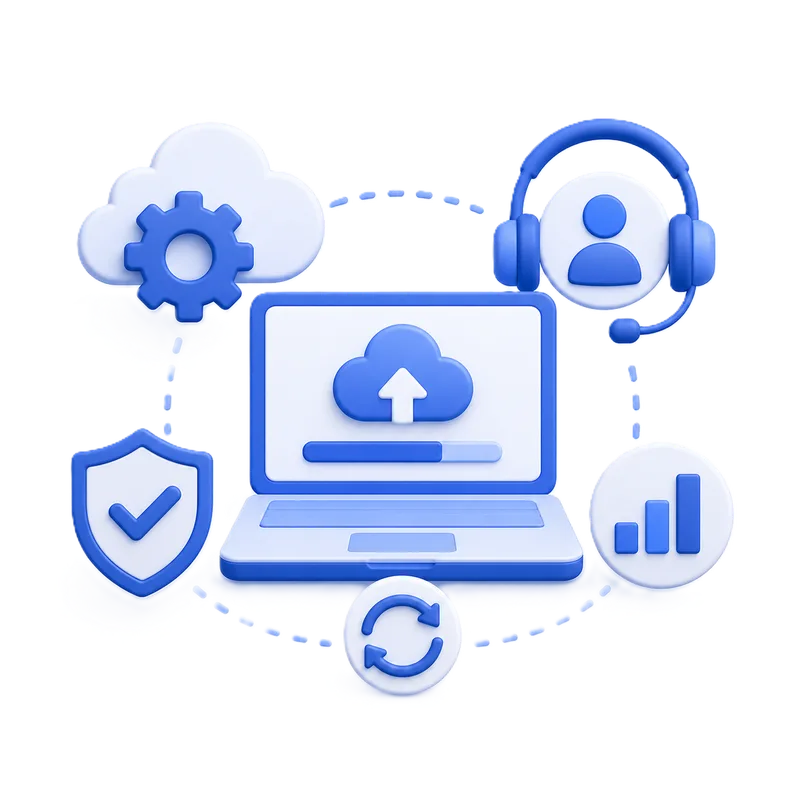
After validating the data, calculations, visualizations, and user experience, we deploy the solution into the appropriate production environment and integrate it with existing workflows.
We provide documentation, user training when appropriate, and post-delivery support. Dashboards can later be refined with new data sources, metrics, reports, access requirements, and analytical capabilities.
Plans & Pricing
Choose a starting plan based on the number of dashboards, custom metrics, data sources, and reporting capabilities required. Final scope and pricing are confirmed after an initial discovery call.
Data Analytics & Visualization
A starting point for different analytics needs
Plans can be adapted according to dashboard complexity, custom metrics, data sources, automation requirements, and organizational needs.
Basic
One interactive dashboard, up to three custom metrics, and one integrated data source.
From USD 1,200
Standard
Up to three dashboards, ten custom metrics, three data sources, and automated reporting.
From USD 3,000
Advanced
Custom dashboards with advanced analytics, forecasting, real-time integration, executive reporting, and access management.
Custom quote
Building Analytics Around Real Decisions
Successful healthcare analytics is not defined only by technical accuracy or visual appearance. Its value depends on whether the information is trusted, understandable, available at the right time, and connected to decisions that matter.
At Argenticare, we combine healthcare-domain expertise with data integration, analytics, and dashboard development to transform fragmented information into practical decision-support tools. Every solution is designed around the organization’s users, goals, workflows, and technical environment.
Ready to Explore AI for Your Organization?
Explore how Argenticare can support your goals with AI, data, and automation.